


Average directional index (ADX) is a forex market indicator used for calculating the strength of a trend. This indicator doesn't take into account any direction (either upward or downward), but it may effectively quantify the actual strength of a trend. This article will explain the basics of how to use ADX in forex trading.
This method is based on comparison 14-period -DI and 14-period +DI, or by subtraction of the second from the first, or through placing the indicators upon each other. When +Di is higher than -DI, that is an obvious purchase signal, if it is just the opposite, then it is for sale.
Indicator ADX calculation technique
The calculation of forex ADX is quite complex and includes the following consecutive steps:
- The current period's directional movement (DM) needs to be evaluated. If we represent today's high less yesterday's high as A and yesterday's low less today's low, as B, the following scenarios will exist:
Values/Scenarios
A < 0 > B go to +DM=0, -DM=0
A > B go to +DM=A, -DM=0
A < B go to +DM=0, -DM=B
+ and - prefixes in DM stand for maximum and minimum values. - True Range (TR) is to be calculated. Usually, period of 14 is used for trading adx calculations in this case.
+DM14 = EMA x +DM for 14 periods
-DM14 = EMA x -DM for 14 periods
TR14 = EMA x TR for 14 periods - Positive and negative directional indicators are assessed:
Positive DI (+DI14) = +DM14 / TR14
Negative DI (-DI14) = -DM14 / TR14 - ADX = SMA of DX
So, how to use ADX in forex? Even though the indicator's calculations may seem complex, it may be quite a handful and easy-to-use tool in virtually any ADX strategy.
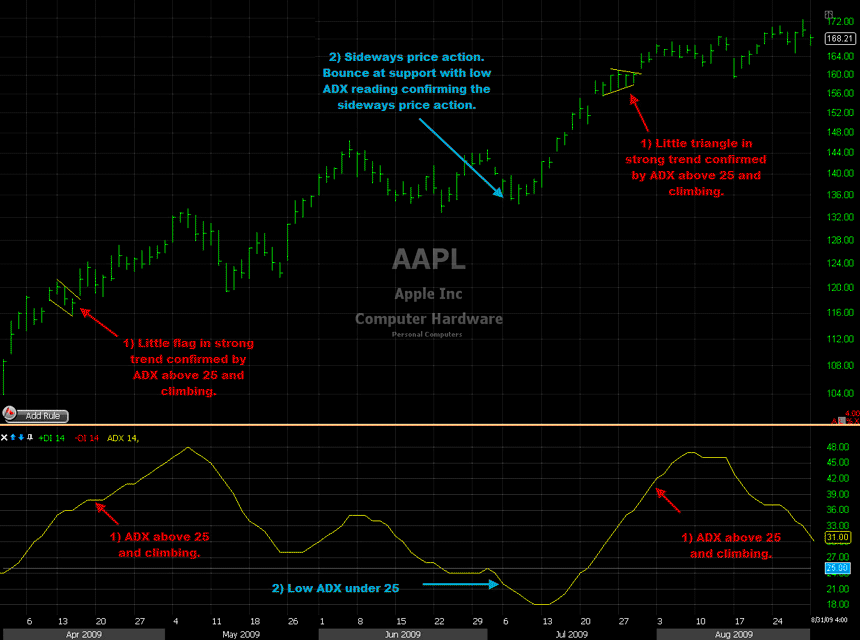
The value of ADX is located on a scale between 0 and 100. Usually, traders monitor the movement of ADX above 25 in order to make sure of a particular trend's strength. Here is a table of general considerations in any trading system with ADX:
ADX / Trend Strength
0-25 / Weak trend or no trend
25-50 / Strong trend
50-75 / Very strong trend
75-100 / Strongest trend
Low ADX trading values may usually be constructed as accumulation, and price conditions can be easily identified in this case. From low ADX, prices tend to break out into trends. Also, it should be noted that the downward movement of the ADX line in ADX forex trading does not necessarily mean negative trend, but rather the weakening strength of the trend. The ADX indicator can be used as a technical analysis tool in many ADX strategies within ADX forex trading.
ADX indicator
For instance, ADX is widely used in different trend trading ADX forex strategy sets where the ADX trading system may be the best option to reveal the strongest and the most high-yield trends. ADX and fast EMA cross system ADX forex trading strategy is another effective forex ADX strategy which uses average directional index together with 200 EMA and short-term EMA crossover for finding the optimum trend entry signals.
Use average directional index effectively in your ADX trading strategy, and you will get growing forex trading profits.